A simple example is helpful for illustrating the idea expressed in Section 3.1. This section explores the application of hybrid models to the domain of simple mouse gestures. Hundreds of examples of circles, triangles, and scribbles were collected. This data was than used to train two classes of HMMs. The HMMs were all initialized to have five states with the possibility of skipping up to two states per transition.
One class of HMMs, the Delta models, were trained on the differences between the last mouse state and the current state. This is a well known technique when using HMMs to recognize human gesture [19].
The other class of HMMs, the Innovation models, were trained on the innovations sequence from a Kalman filter. the innovation is the error between on observation and the prediction of that observation by the linear model inside the filter. That is, these HMMs were trained on the part of the motion that was not solely due to the evolution of a dynamic model.
|
Table 1 shows that from a classification point of view, with 100% recognition rates, both classes of model are describing the data very well. However, it is necessary that the models not only classify the actions of the user, but also allow prediction.
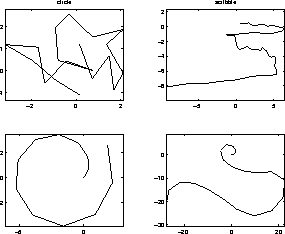 |
Figure 6 demonstrates the difference in the predictive power of two types of model. Locally, where we would expect predictive power to be the strongest, the Delta models provide very noisy output. By contrast the Innovation models produce more reasonable output. The key difference is the lack, in the Delta models, of an explicit representation of the inherent dynamics of the data.
Since the Innovation models have an explicit model of the system dynamics, the HMM parameters can be used to model the innovation, that aspect of the signal that cannot be predicted by the dynamic model. We call patterns in the innovations ``effects of control'' or ``behaviors''. The next section examines more powerful dynamic models.