After my initial investigations, I began to develop the Conductors Jacket system. It consisted of three basic elements: the clothing designs, the sensors, and the A/D hardware.
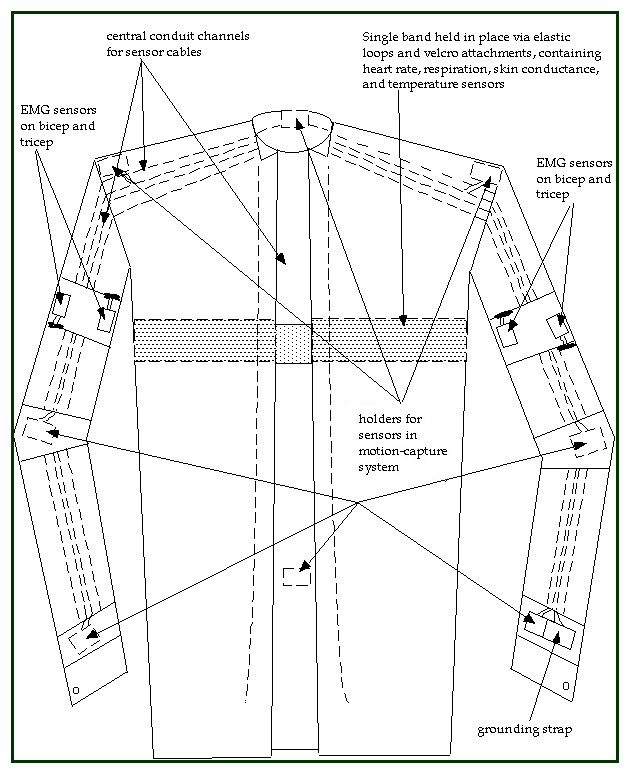
The wearable designs for the Conductors Jacket ranged in style from white oxford cloth shirts to red spandex; in all, four different versions were designed, and eight jackets were constructed and worn. Each subject in the study was fitted and interviewed so that they would be comfortable with the style and size of the outfit. Regardless of the appearance and fit, however, all of the jackets incorporated three critical items: channeled conduits through which the sensor leads could be drawn, looped strain reliefs for keeping the sensors in place, and elastics for holding the sensors immobile on the skin surface. Each design also took into account issues of cleaning the sensors and the cloth. In some cases I constructed the channels with zippers so that the sensors could be easily taken out, but in other cases the sensors could not be removed and the jackets had to be cleaned using spray-on, evaporating cleaners.
Into each jacket were sewn physiological sensors for muscle tension, breathing, heart rate, skin conductance, and temperature. The basic sensor layout for the first jacket was developed in the course of one month and then revised as needed for later subjects. The simplest version had eight sensors and sampling rates of 330 Hz; the most elaborate version incorporated sixteen sensors, two computers, and timed acquisition at 4KHz per channel. The basic equipment in each jacket included the following sensors:
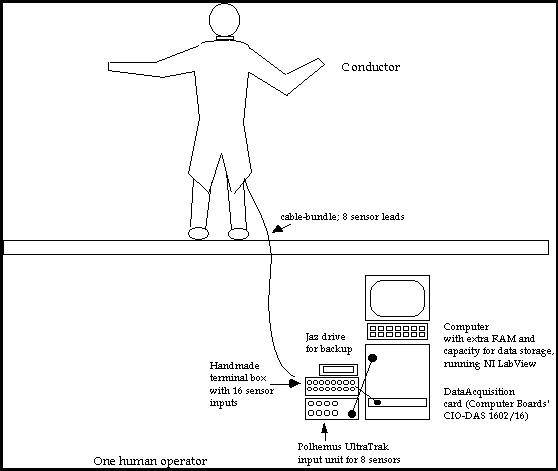
Lastly, I built a robust architecture for data collection using two ISA-bus data acquisition boards (model CIO-DAS 1602/16) from ComputerBoards, Inc. I configured these boards to run equivalently in either Windows 95 or NT, and built up several applications in the Labview development environment to control the sampling rates, file sizes, buffer sizes and channel information during acquisition. The basic idea for data collection was that each jacket had a short tail of sensor leads draping off the back that could be plugged into an external cable. This shielded cable ran 10-30 feet over to a terminal input box, providing power, ground, and up to sixteen sensor input lines. The terminal input box also contained important protection against leaked voltages on each line. The output from the terminal box then plugged into the data acquisition cards in a neighboring computer, which performed a 16-bit A/D conversion on every channel and wrote the data to files on the local hard drive. The data was also graphed on the screen for real-time feedback so that problems with the sensors could be easily detected and fixed. The sampling, graphing, and data storage functions were all controlled by individual applications in Labview. The figure below illustrates the basic system architecture:
After the sensors, jacket, and data acquisition system
were built and tested, I began to approach local conductors to see if they
would be willing to contribute their data. A total of six conductors agreed
to participate in the project, including three professionals and three
students. The professional subjects conducted orchestras during their sessions,
while the students conducted a single pianist as part of their Advanced
Conducting class at the Boston Conservatory. In all cases, physiological
data was collected while they were actively rehearsing or performing, along
with a timed videotape of the session. The videotape was used afterwards
to help identify important events and record the gestures so as to pick
out significant features in the data streams.