Numerous decisions were made based on initial and revised criteria for the project. Some of the most important design issues for the jacket were comfort, mobility, noise reduction, safety, and sampling rates. The number and placement of sensors was also critical, particularly in the choice of muscle groups. I had to take into account the kind of signals that would be most useful, given the movements that the subjects would use the most.
The most important human factor in the design of the Conductors Jacket system was the need to provide a device that would not constrain, encumber, or cause discomfort to a conductor during standard rehearsals and performances. We felt strongly that we should gather data in a professional context, as opposed to a laboratory situation, in order to generate useful and significant results. Because of this choice, we had to conform to the demands of a rehearsal situation and be sensitive to the conductors agenda. The outfit would have to be light, easy to put on and take off, simple to plug in, allow for free movement of the upper body, and be robust enough to withstand the lively, energetic movements of an animated subject. It was crucial that the sensing environment did not constrain the range and style of movement that the performers made.
Secondly, to ensure that it would be practical to use, we had to allow the jacket to be mobile. We were able to do this in two ways: provide a long cable, and put an easy connector on it so it could be removed quickly. The first cable that I used had five connectors on it and a length of 15 feet; the final cable we ended up with had one connector and a length of 30 feet. We also built a wireless data transmission module for the jacket (along with bus architecture that was integrated into the belt along with power and signal conditioning), but it remained a 4-channel prototype due to some basic problems with battery power and radio interference.117
Although the sensors and acquisition hardware were susceptible to external DC, 60Hz, and burst noise, I was able to take some extra precautions against them. My primary noise reduction techniques were to use extra shielding on cables whenever possible and to include a grounding strap in series with op-amps so as to remove common environmental sources. Early investigations into transmission line noise on the cables yielded solutions that would have been impractical to implement. The Delsys EMG sensors that I used also have their own precautions against noise, including differential measurements, a grounding strap, local amplification, and a bandpass filter for the 20-450Hz frequency range. The worst noise typically comes from the DC component of the sensor signal, which was already removed at the sensor in the 0-20 Hz band. Ultimately, the Conductors Jacket system seemed to work equally well in a variety of environments and noise conditions. In fact, the data collection situations yielded less noise than I had expected from tests in the lab, because musical concert halls and rehearsal rooms tend not to be littered with extra power lines and sources of electrical noise.
Another factor was the safety of the subjects; while I was not able to optically isolate them, I did include several conservative protections against electrical charges injuring the subject. These included low voltages, clean external power supplies at +/- 8 volts (instead of using the data acquisition boards +/- 5 volt supply that was tied to the computer) and large capacitors to protect the wearer from becoming a path to ground.
Finally, sampling rates were a concern, since undersampled data would contain aliasing and would not be usable for signal processing tasks. Since events happen extremely quickly and precisely in conducting, the required time-scale is extremely small. Electromyography studies have shown that muscular contractions contain frequencies up to 500Hz118, and my sensors had built-in 20-450 Hz band-pass filters, so they had to be sampled at 900Hz in order to completely capture the signal and satisfy the Nyquist criteria. Early versions of the system were only able to sample at 330Hz, but later improvements increased the sampling rate to 4kHz per channel. (Theoretically I could have sampled up to 12 KHz, but then I would have encountered problems with hard drive space and buffering.)
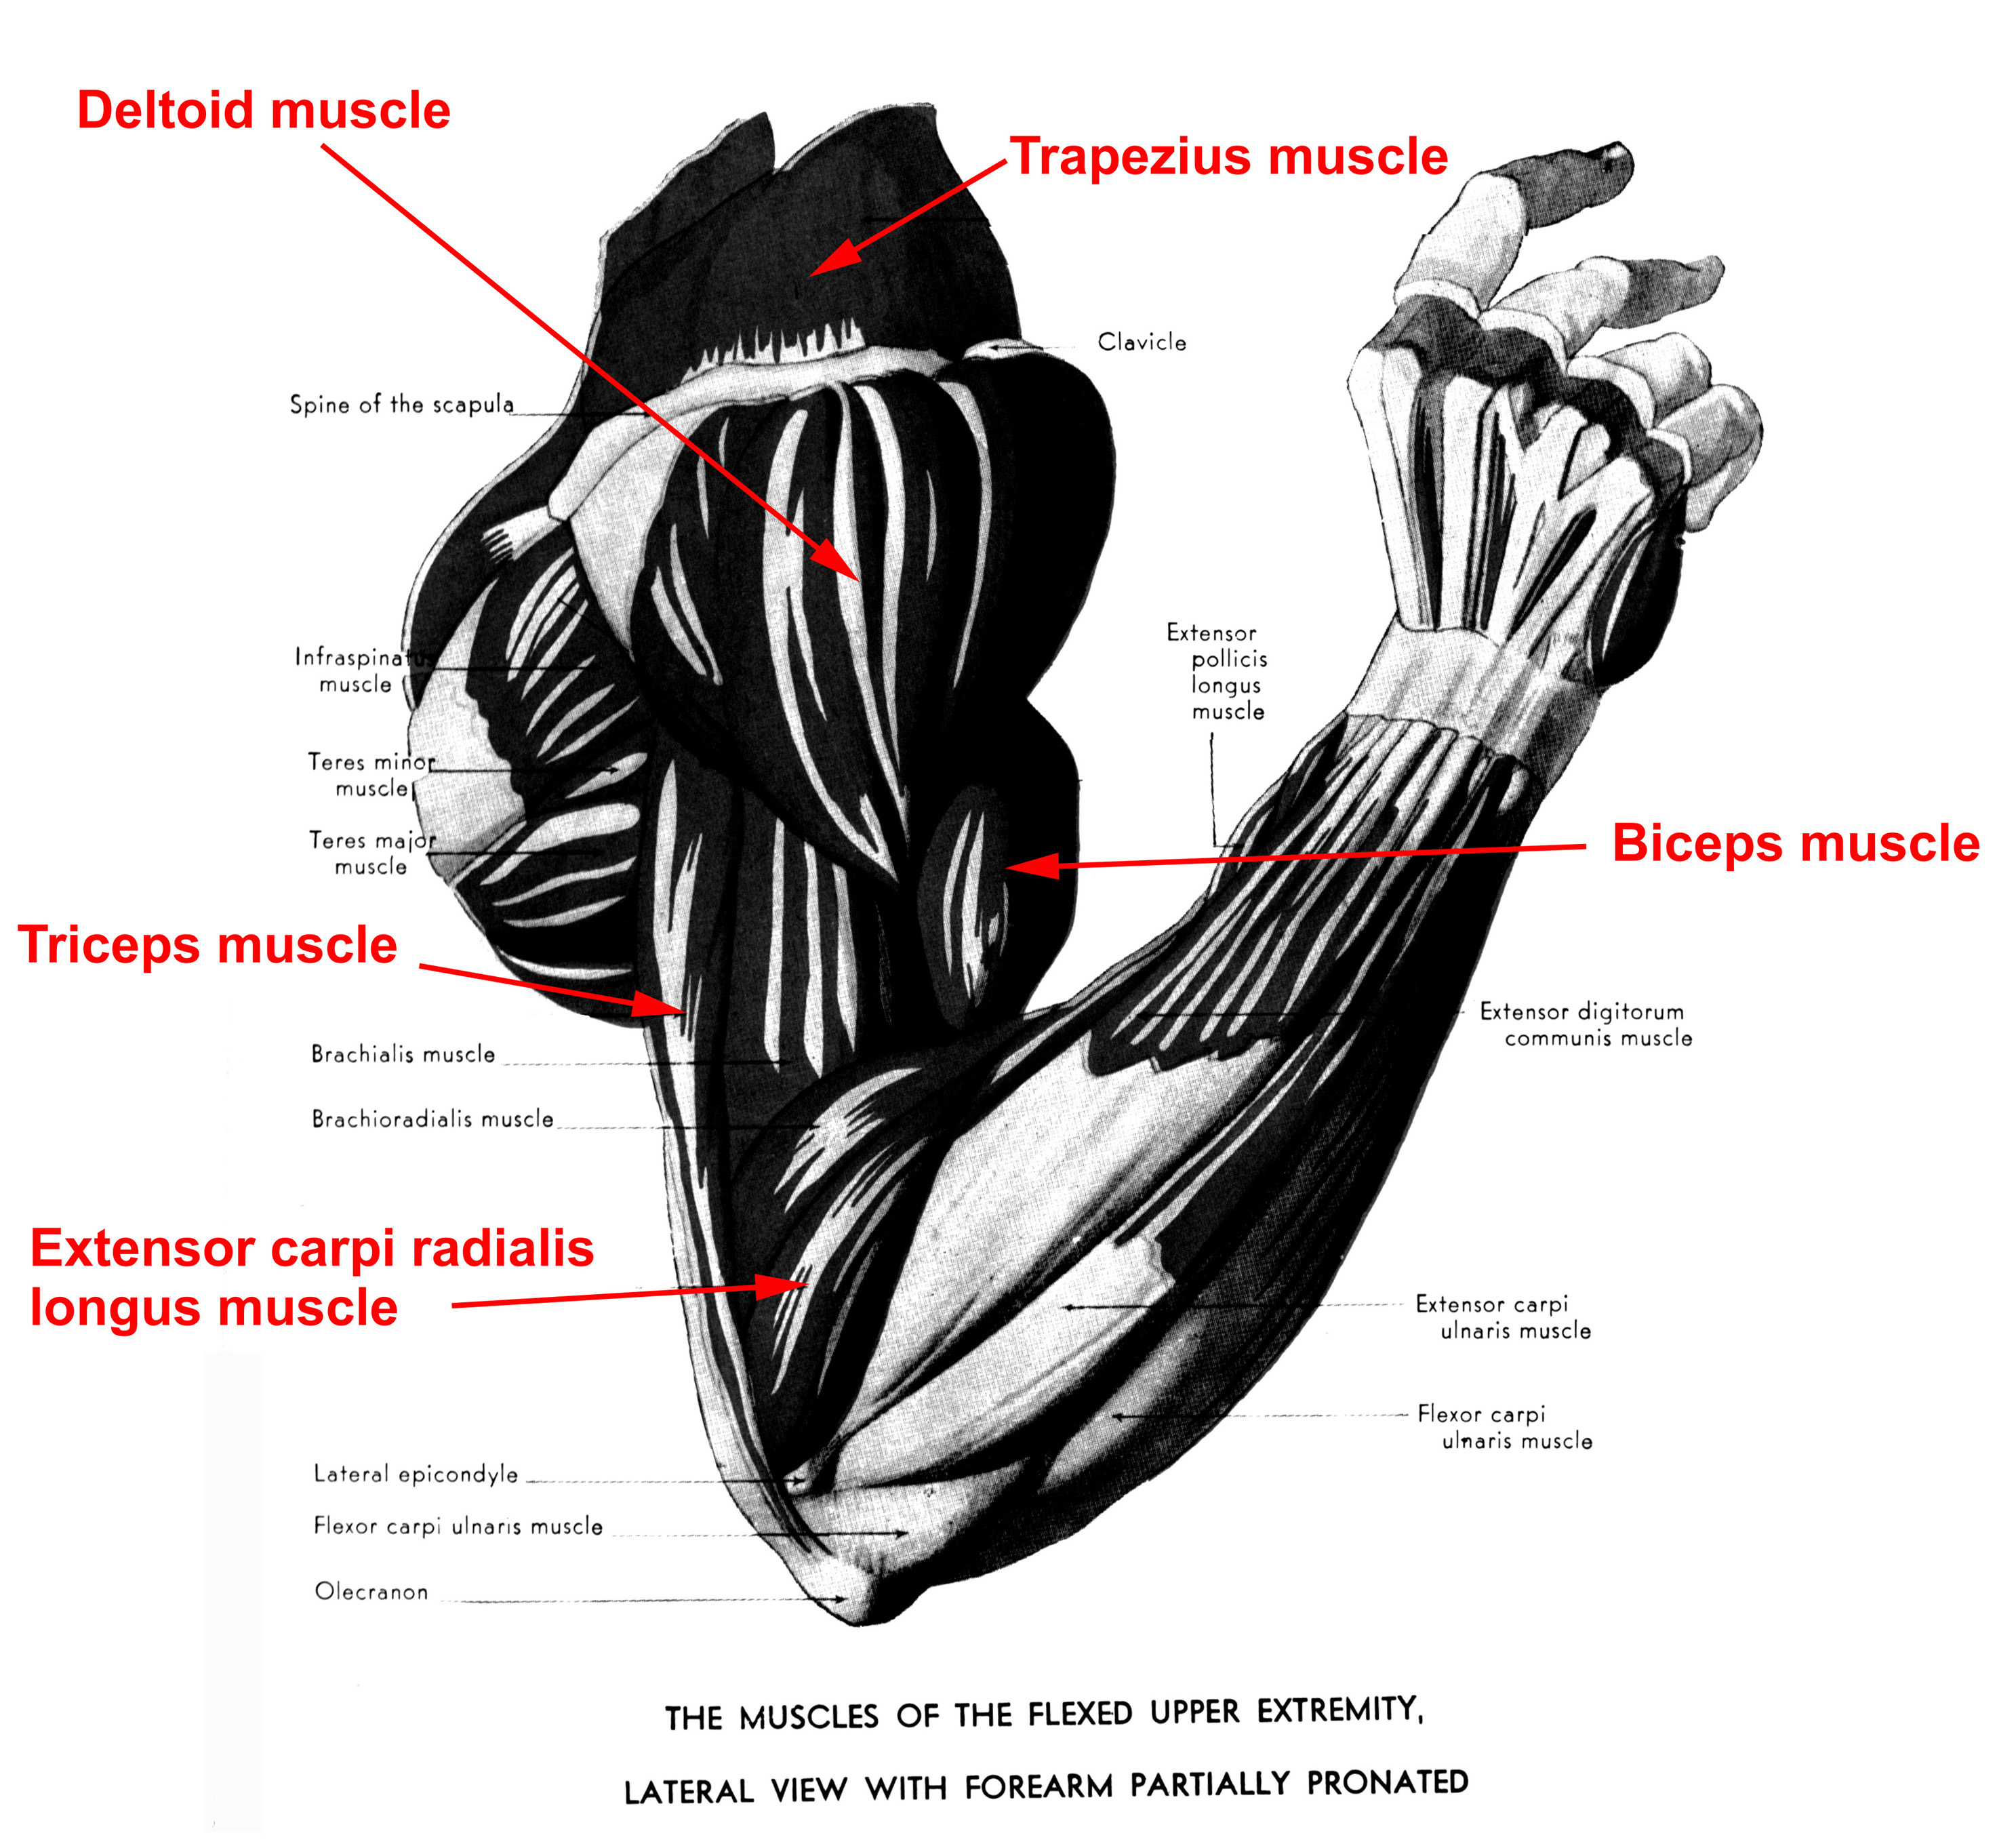
Another design criterion was the number and placement of the sensors, so as to capture enough degrees of freedom to detect the quality and complexity of the subjects motions. Particularly critical for this was the choice of muscles to sense with EMG. My initial pilot studies focused on the bicep, tricep, and lateral deltoid muscles in the upper arm, and so for my first five subjects I put EMG sensors on the biceps and triceps muscles on both arms. However, after inspecting the early data, I realized that the triceps signal did not provide any significant information; the biceps contained all the features that appeared to be useful. This is because the biceps and triceps muscles are oppositional, and therefore are both activated in a forceful gesture that stops and rebounds, as beat gestures do. The differences came in the activation times of the muscle (usually the triceps was activated at the beginning and ending of the beat signal) and the overall amplitude, which was lower in the triceps than the biceps.
For my final subject I chose to replace the triceps measurement with the extensor muscle (extensor carpi radialis longus) in the forearm. This muscle runs along the outside edge of the forearm, connecting the upper arm bone to the hand. Its primary function is to extend the wrist and abduct the hand, which are also gestures that are used extensively in conducting. The EMG measurement of this muscle in the final subject of this study turned out to be extremely interesting because it provided information about the use of the wrist, particularly when it differed from the use of the upper arm.
In the final version of the jacket that was used for real-time interactive performances, I added the opponens pollicis muscle in the hand and the trapezius muscle in the shoulder. The trapezius covers the back of the neck and the shoulder, and is used to raise or draw the shoulder back; after the fact I think it would have been an excellent measurement to take with the Conductors Jacket data collection project. The opponens pollicis muscle in the palm flexes and adducts the thumb; I think it would not have been a good choice in the conductor study since it would have impeded the normal use of the baton.
3.3.2 Measures of expression that were not used
There were also many potentially useful measures that I considered for the jacket, but decided against. In most cases, these measures would have been distracting or restricting in some way for the conductor. Nonetheless, I list them here because I think that if sensing methods can be found that are less bulky or visible, they might be promising for future studies.
Eye contact
Some conductors feel that the eyes provide their most important mechanism for communication; I have received many anecdotal comments from them on this subject. Max Rudolf discusses this in his book:
Facial expressions
I noticed informally that one student subject had very little facial expression and that one professional subject demonstrated many extreme facial expressions. It would have been wonderful to be able to compare the number, frequency, and dynamic range of individuals facial expressions. However, as with eye contact, the sensors for facial expression either require a fixed position for vision detection or the use of contact electrodes. For the same reason, I discounted this as an option. However, I do not discount the importance of facial expression:
One last aspect which I had originally intended to measure were the subjects opinions about how the rehearsal had gone and what they had intended to convey in certain places. My plan was to give them a short survey after the event and sit with a display of the video and the correlated signals to review the significant events in the data. I had hoped that this would yield greater insight into the phenomena and improve the analysis. This may have been possible, but initial discussions with the conductors introduced two problems: first, several of them were not willing to spend the time to do a follow-up interview and analysis session. Secondly, when I initially showed two subjects their data in real-time, they demonstrated aversion or assumed that they would be evaluated based on their signals. For example, they assumed a certain advantage to signals that had greater amplitudes. In another interview, I asked the teacher of my three student subjects to discuss his interpretive schemes, and the result was not systematic or analytical enough to use in evaluating the data. After these sessions with the conductors, I decided not to go ahead with the follow-up sessions, although they may have yielded interesting results.
3.3.3 Design/Implementation Problems
There were several hardware problems encountered with the design of the system; some were solved satisfactorily. For example, during timed acquisition of the samples, I found that there was a glitching problem. The data acquisition cards maximum acquisition rate was 100,000 samples per second, which, divided by 8 channels, should yield a maximum rate of 12.5KHz per channel. (This turned out not to be quite possible with the hardware, for reasons that remain unexplained. But 4 KHz per channel seemed to work well.) So I acquired 8 sensor channels at 4 KHz sampling rate each (controlled by the rate utility in Labview), and only set 800 samples to fill the buffer (controlled by the count utility in Labview) before writing the data to disk.
Despite the fact that I stayed well within the stated hardware limits, I discovered a problem -- it seemed that after every buffer was cleared, there would be a few samples in every channel that were clearly erroneous. This created the appearance of regular noise bursts in one subjects concert data. I later discovered that this noise was not random or stochastic, but rather samples from a neighboring channel. I wrote a filter to find this noise and put it back in the right file; this filter is discussed in section 3.5.2. However, filtering after the fact is not optimal; it would be better to not have these glitches occur. Because of the glitches, I had to find an appropriate tradeoff between using small buffer sizes to achieve real-time graphical updates, and large buffer sizes to reduce the number of glitches. Another egregious problem of the glitches was that they seemed to introduce delays into the timed data; over the course of five minutes, approximately 10-20 seconds would be lost. This made the analysis more difficult because the timing intervals had to be shifted slightly.
Perhaps I could have looked for more expensive data acquisition hardware to eliminate this problem, since it seemed to originate from a failure in the demultiplexer of my data acquisition card. Upon inspection, it appeared to be a multiplexing error whereby the noise in channel n seems to be legitimate samples from channel n+1. Amazingly, none of this noise made it into the real-time graphical representation of the signals, which is why I didnt catch it much earlier. My only theory about this is that the refresh rate of Labview and the monitor combined to form a kind of Low-Pass filter which neatly filtered out all the high-frequency noise blips.
A second major problem, which I never solved satisfactorily, was the issue of synching the video with the incoming samples. Because I did not have consistent access to the same video camera, I was not able to develop a technical solution to the problem. One ideal solution would have been to use Labview to send a serial command to a Sony digital video camera to start and stop recording; this serial command could have been controlled to the millisecond using the same timer that controlled the acquisition of samples. Although there would have been an unavoidable mechanical delay in the response to those commands, that may have been acceptable. Instead, I kept a record by hand; I would first start the camera and let it run for the entire session, and when starting up the data acquisition would make a note of the files start time relative to the video cameras time code. There were a few files for which this data was lost or inaccurate, and those files timing information had to be reconstructed or approximated. However, it turned out that the clarity of the beat signals made the reconstruction process easier than I had anticipated.