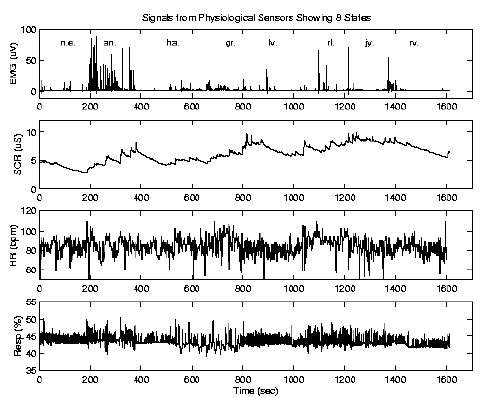
A total of eleven features were used to differentiate affective state: the mean EMG activity, the mean and mean slope of the skin conductivity, average heart rate and heart rate change, and the normalized mean, variance, and four power spectral density characteristics of the respiration signal. Anger was most easily distinguished in many cases; however, the power spectral density analysis for respiration showed a distinct signature for grief. Sample signals from the four physiological signals are shown in Figure 1. The annotations in the top graph indicate the times at which the subject expressed no emotion, anger, hate, grief, love, romantic love, joy and reverence.
Eleven features were calculated from the four signals. The EMG on the masseter (jaw) muscle captured the presence or absence of activity in the muscle. For this signal the mean activity over each emotion period was calculated (EMG1).
 |
The skin conductivity response (SCR) sensor detected chances in the electrical
conductance of the palm of the hand. A long averaging window (25
second hanning) was used to smooth the raw data and characterize the
general trend of each affective
state. The signal was normalized using the following suggested criteria to
account for baseline fluctuations between days [5]:
Heart rate was calculated by taking the inverse of the inter-beat interval from the blood volume pulse waveform. For each emotion, the mean of this rate was calculated (HR1). Also, the average acceleration or deceleration of the heart rate was calculated by taking the mean of the first difference of the heart rate (HR2).
The respiration sensor measured expansion and contraction of the chest cavity using a Hall effect sensor attached around the chest with a velcro band. The signal was normalized by subtracting off the overall mean of the data for that day to account for variations in the initial tightness of the sensor placement from day to day.
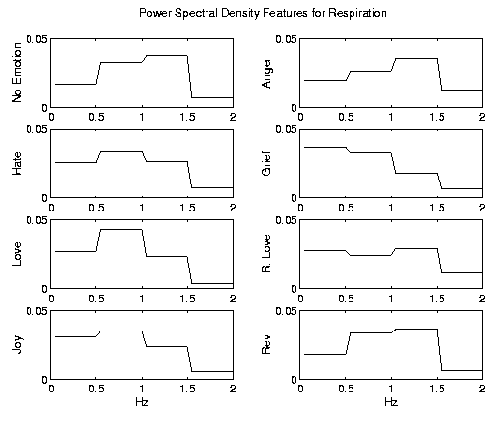
The mean and variance of this normalized signal were calculated for each emotion state (RT1, RT2) in the time domain. A power spectral density analysis of the signal was also calculated and provided a characteristic signature for some affective states as shown in Figure 2. The features (RF1-RF4) represent the average energy in each of the first four 0.5Hz bands of the PSD (0-2Hz).
The physiological features extracted were hypothesized to reflect the physiological changes in the person experiencing the emotion. The mean of the EMG was originally intended to detect jaw clenching during the emotion anger. However, higher mean activation during joy and grief indicates that smiling or frowning will also be detected with this feature. For the skin conductivity, the slope was more discriminating than the mean. Over the three minute period, the skin conductance tends to gradually increase for arousing emotions and tends to decrease for less arousing states. The mean heart rate for each emotion was more discriminating than the measure of heart rate acceleration chosen. For this time window it may be that the more general measure of overall rate is more descriptive, whereas for a shorter time window, heart rate acceleration has been a more discriminating feature [6]. For the respiration signal, the mean and variance of the time signal together differentiated between shallow regular breathing, shallow breathing punctuated by deep gasps and regular deep breathing. The PSD energy band features give more general characterization of the rhythmic patterns of respiration in each emotion state.