| Getting Started | |
Mesh and Surface Plots
MATLAB defines a surface by the z-coordinates of points above a grid in the x-y plane, using straight lines to connect adjacent points. The mesh and surf plotting functions display surfaces in three dimensions. mesh produces wireframe surfaces that color only the lines connecting the defining points. surf displays both the connecting lines and the faces of the surface in color.
Visualizing Functions of Two Variables
To display a function of two variables, z = f (x,y),
X and Y matrices consisting of repeated rows and columns, respectively, over the domain of the function.
X and Y to evaluate and graph the function.
The meshgrid function transforms the domain specified by a single vector or two vectors x and y into matrices X and Y for use in evaluating functions of two variables. The rows of X are copies of the vector x and the columns of Y are copies of the vector y.
Example--Graphing the sinc Function
This example evaluates and graphs the two-dimensional sinc function, sin(r)/r, between the x and y directions. R is the distance from origin, which is at the center of the matrix. Adding eps (a MATLAB command that returns the smallest floating-point number on your system) avoids the indeterminate 0/0 at the origin.
[X,Y] = meshgrid(-8:.5:8);
R = sqrt(X.^2 + Y.^2) + eps;
Z = sin(R)./R;
mesh(X,Y,Z,'EdgeColor','black')
By default, MATLAB colors the mesh using the current colormap. However, this example uses a single-colored mesh by specifying the EdgeColor surface property. See the surface reference page for a list of all surface properties.
You can create a transparent mesh by disabling hidden line removal.
See the hidden reference page for more information on this option.
Example--Colored Surface Plots
A surface plot is similar to a mesh plot except the rectangular faces of the surface are colored. The color of the faces is determined by the values of Z and the colormap (a colormap is an ordered list of colors). These statements graph the sinc function as a surface plot, select a colormap, and add a color bar to show the mapping of data to color.
See the colormap reference page for information on colormaps.
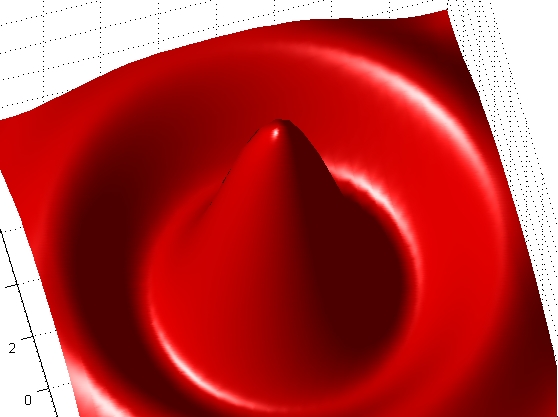
Surface Plots with Lighting
Lighting is the technique of illuminating an object with a directional light source. In certain cases, this technique can make subtle differences in surface shape easier to see. Lighting can also be used to add realism to three-dimensional graphs.
This example uses the same surface as the previous examples, but colors it red and removes the mesh lines. A light object is then added to the left of the "camera" (that is the location in space from where you are viewing the surface).
After adding the light and setting the lighting method to phong, use the view command to change the viewpoint so you are looking at the surface from a different point in space (an azimuth of -15 and an elevation of 65 degrees). Finally, zoom in on the surface using the toolbar zoom mode.
| | Using the Property Editor | Images | |