| EXPERIMENTAL
DATA |
|
|
|
|
|
|
|
|
|
| Test
# |
Send->receive |
Control |
Correct out of seven |
Scheme |
|
| 1 |
Noga->Zahra |
1 |
4 |
emotion |
|
| 2 |
V-> Dave |
0 |
3 |
coding |
|
| 3 |
Sarah-> Ian |
1 |
1 |
coding |
|
| 4 |
Goce-> Landi |
0.5 |
2 |
coding |
|
| 5 |
Rory-> Jim |
1 |
0 |
coding |
|
| 6 |
Caroline-> Joe |
1 |
1 |
emotion |
|
| 7 |
Karolina-> Vishi |
0 |
2 |
emotion |
|
|
|
|
|
|
| *ran
#4 twice at Landi's request |
|
|
|
|
|
|
|
| Theory:
Probability of getting k out of n ordered possibilites correct |
|
|
| 1/k! -1/K+1! |
chance |
|
|
|
|
|
| k |
P |
|
|
|
| 0 |
0.001364 |
|
|
|
|
| 1 |
0.500000 |
|
|
|
|
|
| 2 |
0.333333 |
|
|
|
| 3 |
0.125000 |
|
|
|
| 4 |
0.033333 |
|
|
|
| 5 |
0.006944 |
|
|
|
|
|
| 6 |
0.001190 |
|
|
|
| 7 |
0.001364 |
|
|
|
|
|
|
|
|
|
|
|
| Figure
out who did better than chance |
|
|
| Determination
of chance for each test |
|
|
|
|
| Test
# |
Send->receive |
Correct out of seven |
Control |
Out of 7 |
Outcome |
Scheme |
|
| 1 |
Noga->Zahra |
4 |
0.33 |
0.571428571 |
Better |
emotion |
|
| 2 |
V-> Dave |
3 |
0.00 |
0.428571429 |
Better |
coding |
|
| 3 |
Sarah-> Ian |
1 |
0.33 |
0.142857143 |
worse |
coding |
|
| 4 |
Goce-> Landi |
2 |
0.17 |
0.285714286 |
Better |
coding |
|
| 5 |
Rory-> Jim |
0 |
0.33 |
0 |
worse |
coding |
|
| 6 |
Caroline-> Joe |
1 |
0.33 |
0.142857143 |
worse |
emotion |
|
| 7 |
Karolina-> Vishi |
2 |
0.00 |
0.285714286 |
Better |
emotion |
|
|
|
|
|
|
|
| for
graphing |
|
|
|
| |
Number |
|
|
|
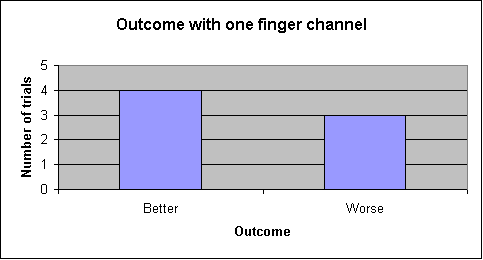
| Better |
4 |
|
|
|
|
|
| Worse |
3 |
|
|
|
|
|
|
|
|
|
|
|
|
|
|
|
|
|
|
|
|
|
|
|
|
|
|
|
|
|
|
|
|
|
|
|
|
|
|
|
|
|
|
|
|
|
|
|
|
|
|
|
|
|
|
|
|
|
|
|
|
|
|
|
|
|
|
|
|
|
|
|
|
|
|
|
| Sorted
by Communication Scheme |
|
|
|
|
|
| Test
# |
scheme |
Send->receive |
Control |
Chance |
Experiment |
outcome |
|
| 1 |
emotion |
Noga->Zahra |
0.33 |
0.033333333 |
0.571428571 |
better |
|
| 7 |
emotion |
Karolina-> Vishi |
0.00 |
0.333333333 |
0.285714286 |
worse |
|
| 6 |
emotion |
Caroline-> Joe |
0.33 |
0.5 |
0.142857143 |
better |
|
| 5 |
coding |
Rory-> Jim |
0.33 |
0.001364087 |
0 |
worse |
|
| 4 |
coding |
Goce-> Landi |
0.33 |
0.333333333 |
0.285714286 |
better |
|
| 2 |
coding |
V-> Dave |
0.00 |
0.125 |
0.428571429 |
better |
|
| 3 |
coding |
Sarah-> Ian |
0.33 |
0.5 |
0.142857143 |
better |
|
|
|
|
|
|
|
Comparison of 2
groups |
|
|
|
Emoters |
Mean |
standard deviation |
|
|
CONTROL |
0.22 |
0.19245009 |
|
|
EXPERIMENT |
0.333333333 |
0.21821789 |
|
|
|
|
|
|
|
|
|
|
|
|
Coders |
Mean |
ctrl delta |
|
|
CONTROL |
0.25 |
0.220969973 |
|
|
EXPERIMENT |
0.239924355 |
0.184427778 |
|
|
|
|
|
|
|
|
for graphing |
|
|
|
|
Time |
Emoters |
Coders |
|
|
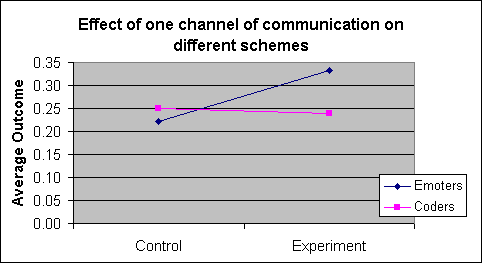
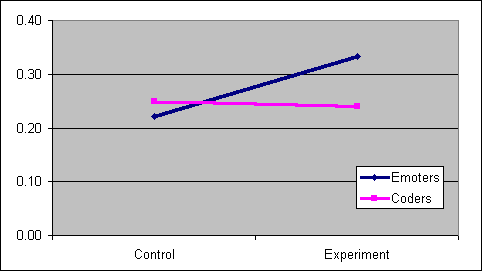
Control |
0.22 |
0.25 |
|
|
Experiment |
0.333333333 |
0.24 |
|
|
|
|
|
|
|
|
|
|
|
|
|
|
|
|
|
|
|
|
|
|
|
|
|
|
|
|
|
|
|
|
|
|
|
|
|
|
|
|
|
|
|
|
|
|
|
|
|
|
|
|
|
|
|
|
|
|
|
|
|
|
|
|
|
|
|
|
|
|
|
|
|
|
|
|
|
|
|
|
|
|
|
|
|
|
|
|
|
|
|
|
|
|
|
|
|
|
|
|
|
|
|
|
|
|
|
|
|
|
|
|
|
|
|
|
|
|
|
|
|
|
|
|
|
|
|
|
|
|
|
|
|
|
|
|
|
|
|
|
|
|
|
|
|
|
|
|
|
|
|
|
|
|
|
|
|
|
|
|


