| Getting Started | |
Adding Plots to an Existing Graph
The hold command enables you to add plots to an existing graph. When you type
MATLAB does not replace the existing graph when you issue another plotting command; it adds the new data to the current graph, rescaling the axes if necessary.
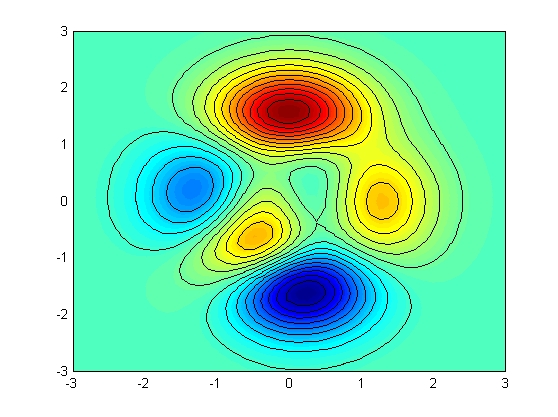
For example, these statements first create a contour plot of the peaks function, then superimpose a pseudocolor plot of the same function.
The hold on command causes the pcolor plot to be combined with the contour plot in one figure.
| | Imaginary and Complex Data | Figure Windows | |