| Getting Started | |
Multiple Plots in One Figure
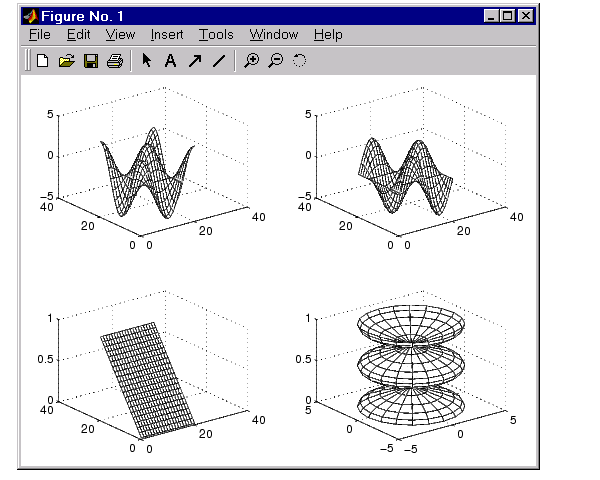
The subplot command enables you to display multiple plots in the same window or print them on the same piece of paper. Typing
partitions the figure window into an m-by-n matrix of small subplots and selects the pth subplot for the current plot. The plots are numbered along first the top row of the figure window, then the second row, and so on. For example, these statements plot data in four different subregions of the figure window.
t = 0:pi/10:2*pi;
[X,Y,Z] = cylinder(4*cos(t));
subplot(2,2,1); mesh(X)
subplot(2,2,2); mesh(Y)
subplot(2,2,3); mesh(Z)
subplot(2,2,4); mesh(X,Y,Z)
| | Figure Windows | Controlling the Axes | |