
| Graphics |   |
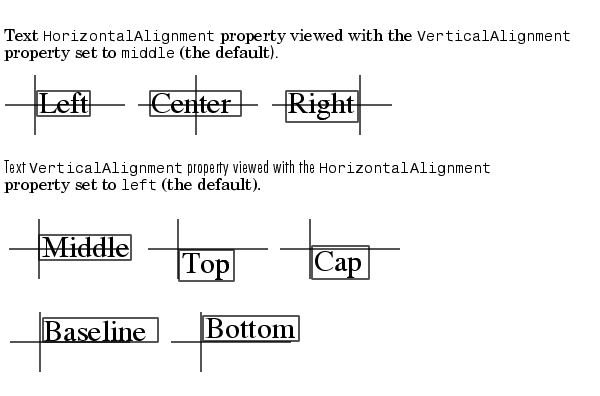
The HorizontalAlignment and the VerticalAlignment properties control the placement of the text characters with respect to the specified x-, y-, and z-coordinates. The following diagram illustrates the options for each property and the corresponding placement of the text.

HorizontalAlignment = left
VerticalAlignment = middle
MATLAB does not place the text String exactly on the specified Position. For example, the previous section showed a plot with a point annotated with text. Zooming in on the plot enables you to see the actual positioning of the text.
The small dot is the point specified by the text Position property. The larger dot is the bullet defined as the first character in the text String property.
Example - Aligning Text
Suppose you want to label the minimum and maximum values in a plot with text that is anchored to these points and that displays the actual values. This example uses the plotted data to determine the location of the text and the values to display on the graph. One column from the peaks matrix generates the data to plot.
The first step is to find the indices of the minimum and maximum values to determine the coordinates needed to position the text at these points (get, find). Then create the string by concatenating the values with a description of what the values are.
x = get(h,'XData'); % Get the plotted data
y = get(h,'YData');
imin = find(min(y) == y);% Find the index of the min and max
imax = find(max(y) == y);
text(x(imin),y(imin),[' Minimum = ',num2str(y(imin))],...
    'VerticalAlignment','middle',...
    'HorizontalAlignment','left',...
    'FontSize',14)
text(x(imax),y(imax),['Maximum =  ',num2str(y(imax))],...
    'VerticalAlignment','bottom',...
    'HorizontalAlignment','right',...
    'FontSize',14)
The text function positions the string relative to the point specified by the coordinates, in accordance with the settings of the alignment properties. For the minimum value, the string appears to the right of the text position point; for the maximum value the string appears above and to the left of the text position point. The text always remains in the plane of the computer screen, regardless of the view.
 | Creating Text Annotations with the text or gtext Command | Editing Text Annotations |  |