| Graphics | |
Example -- Using Function Handles in a GUI
This example shows how to create a simple GUI that plots variables that exist in the base workspace. It is defined in a single M-file that contains both the layout commands and the callbacks. This example uses function handles to specify callback functions. See Function Handle Callbacks for more information on the use of function handle callbacks.
| Note The following link executes MATLAB commands and is designed to work within the MATLAB Help browser. |
Click this link to display the example code in the MATLAB editor.
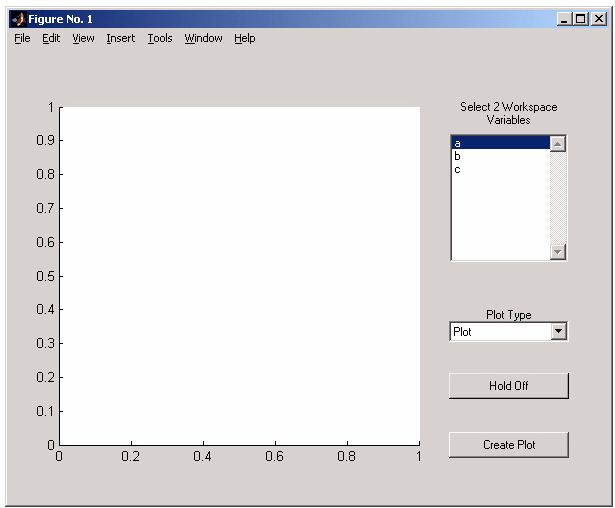
Here is what the GUI looks like.
The GUI Layout
The first step is to define each component in the GUI and save the handles.
function plot_vars
% Define the GUI layout
h_figure = figure('Units','characters',...
    'Position',[72 38 120 35],...
    'Color',get(0,'DefaultUicontrolBackgroundColor'),...
    'HandleVisibility','callback');
h_axes = axes('Units','characters',...
    'Position',[10 4.5 72 26],...
    'Parent',h_figure);
h_listbox_label = uicontrol(h_figure,...
    'Style','text',...
    'Units','characters',...
    'Position',[88 29 24 2],...
    'String','Select 2 Workspace Variables');
h_listbox = uicontrol(h_figure,...
    'Style','listbox',...
    'Units','characters',...
    'Position',[88 18.5 24 10],...
    'BackgroundColor','white',...
    'Max',10,'Min',1,...
    'Callback',@listbox_callback);
h_popup_label = uicontrol(h_figure,..
    'Style','text',...
    'Units','characters',...
    'Position',[88 13 24 2],...
    'String','Plot Type');
h_popup = uicontrol(h_figure,...
    'Style','popupmenu',...
    'Units','characters',...
    'Position',[88 12 24 2],...
    'BackgroundColor','white',...
    'String',{'Plot','Bar','Stem'});
h_hold_toggle = uicontrol(h_figure,..
    'Style','toggle',...
    'Units','characters',...
    'Position',[88 8 24 2],...
    'String','Hold State',...
    'Callback',{@hold_toggle_callback,h_axes});
h_plot_button = uicontrol(h_figure,...
    'Style','pushbutton',...
    'Units','characters',...
    'Position',[88 3.5 24 2],...
    'String','Create Plot',...
'Callback',{@plot_button_callback,h_listbox,h_popup,h_axes});
Initialize the GUI
The list box and the hold toggle button need to be initialized before the GUI is ready to use, which is accomplished by executing their callbacks. Note that you must specify all the arguments when calling these functions since we are not evaluating function handles here.
% Initialize list box and make sure% the hold toggle is set correctlylistbox_callback(h_listbox,[]) hold_toggle_callback(h_hold_toggle,[],h_axes)
The Callback Functions
Only the list box, toggle button, and plot push button have callbacks.
List Box Callback. The list box callback takes advantage of the callback object handle (first argument) generated by MATLAB to set the String property to the current list of workspace variables.
Note that for simplicity, the contents of the list box is updated every time the user selects an item. A separate update button would be a more robust approach.
% Callback for list boxfunction listbox_callback(obj,eventdata)% Load workspace vars into listboxvars = evalin('base','who'); set(obj,'String',vars)
Toggle Button Callback. The toggle button callback requires two additional arguments -- the handles of the GUI figure and axes. We can use the handles saved when we created the figure and axes (h_figure and h_axes) because function handle callbacks will execute within the context of this M-file.
We want the GUI to call the hold command, but hold operates only on the current figure. Our GUI figure cannot become the current figure because we've hidden its handle. To implement the functionality of hold, this callback sets the axes NextPlot property directly.
% Callback for hold state toggle buttonfunction hold_toggle_callback(obj,eventdata,h_axes) button_state = get(obj,'Value'); if button_state == get(obj,'Max')% toggle button is pressedset(h_axes,'NextPlot','add') set(obj,'String','Hold On') elseif button_state == get(obj,'Min')% toggle button is not pressedset(h_axes,'NextPlot','replace') set(obj,'String','Hold Off') end
Plot Button Callback. The plot button callback performs three tasks:
% Callback for plot buttonfunction plot_button_callback(obj,eventdata,h_listbox,h_popup,h_axes)% Get workspace variablesvars = get(h_listbox,'String'); var_index = get(h_listbox,'Value'); if length(var_index) ~= 2 errordlg('You must select two variables',... 'Incorrect Selection','modal') return end% Get data from base workspacex = evalin('base',vars{var_index(1)}); y = evalin('base',vars{var_index(2)});% Get plotting commandselected_cmd = get(h_popup,'Value');% Make the GUI axes currentaxes(h_axes)% Call appropriate command based on what user selectedswitch selected_cmd case 1% user selected plotplot(x,y) case 2% user selected barbar(x,y) case 3% user selected stemstem(x,y) end
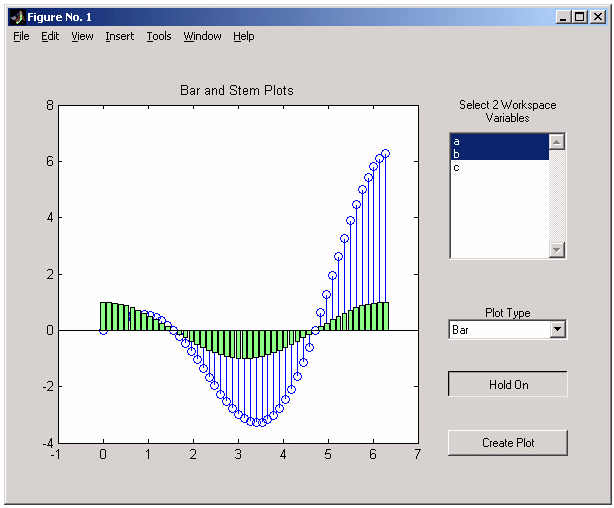
Using the GUI
Select some variables from the workspace and overlay stem and bar plots.
| | Why Use Function Handle Callbacks | Figure Properties | |