| Graphics | |
Axis Limits and Ticks
MATLAB selects axis limits based on the range of the plotted data. You can specify the limits manually using the axis command. Call axis with the new limits defined as a four-element vector.
Note that the minimum values must be less than the maximum values.
Semiautomatic Limits
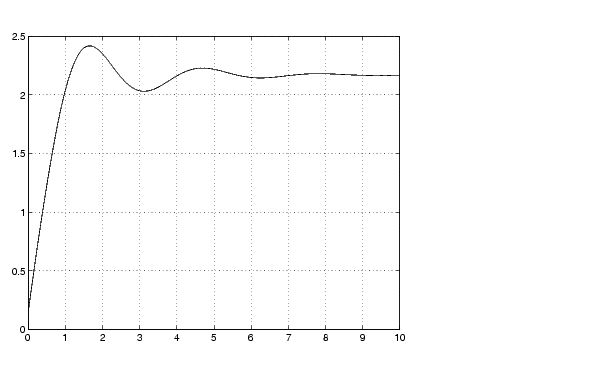
If you want MATLAB to autoscale only one of a min/max set of axis limits, but you want to specify the other, use the MATLAB variable Inf or -Inf for the autoscaled limit. For example, this graph uses default scaling.
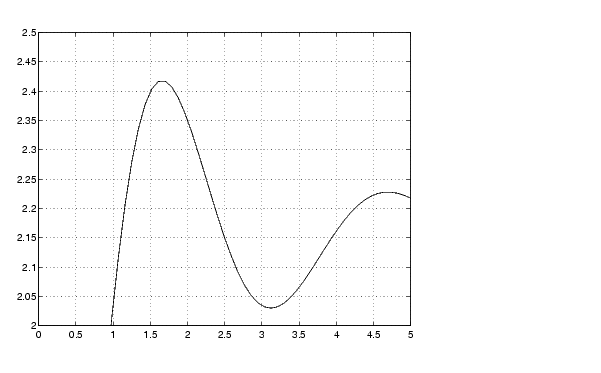
Compare the default limits to the following graph, which sets the maximum limit of the x-axis, but autoscales the minimum limit.
Axis Tick Marks
MATLAB selects the tick mark locations based on the range of data so as to produce equally spaced ticks (for linear graphs). You can specify different tick marks by setting the axes XTick and YTick properties. Define tick marks as a vector of increasing values. The values do not need to be equally spaced.
For example, setting the y-axis tick marks for the graph from the preceding example,
produces a graph with only the specified ticks on the y-axis.
Note that if you specify tick mark values that are outside the axis limits, MATLAB does not display them (that is, specifying tick marks cannot cause axis limits to change).
| | Setting Axis Parameters | Example - Specifying Ticks and Tick Labels | |