| Creating Graphical User Interfaces | |
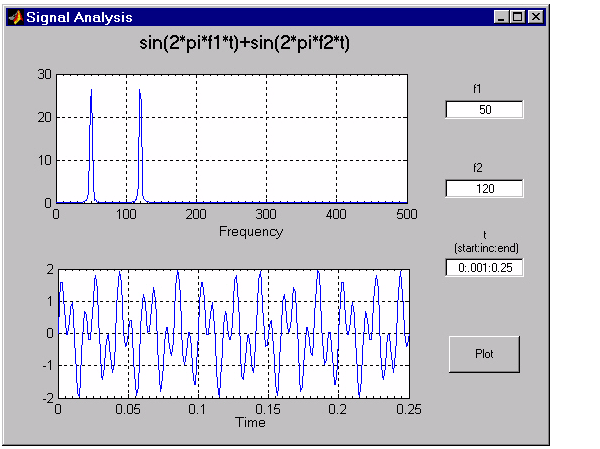
This example creates a GUI that contains two axes for plotting data. For simplicity, this example obtains data by evaluating an expression using parameters entered by the user.
Techniques Used in the Example
GUI-building techniques illustrated in this example include
View the Layout and GUI M-File
If you are reading this in the MATLAB Help browser, you can click the following links to display the GUIDE Layout Editor and the MATLAB Editor with a completed version of this example. This enables you to see the values of all component properties and to understand how the components are assembled to create the GUI. You can also see a complete listing of the code that is discussed in the following sections.
| | Application Examples | Design of the GUI | |