Once the majority of the work for the analysis (Chapter 4) and interpretation (Chapter 5) stages was completed, active development began on the Gesture Construction, the final component of this doctoral project. The Gesture Construction is a real-time musical system that uses the Conductors Jacket to control its musical behaviors. This system has several components, including a revision and extension of the original Conductors Jacket data collection hardware, a range of real-time filters, and a software system for mapping the gestural data to music.
The idea behind the Gesture Construction system is to detect expressive features from incoming Conductors Jacket data in real-time and synthesize them into a range of musical effects. Ideally, these effects convey qualities that general audiences can recognize as being similar to the original, visually-perceived gesture. The reason to attempt such an ambitious task is to synthesize some of the analyses and hypotheses from the visual interpretation of the data and see if they sound "right" and "intuitive" to both trained professionals and the public. While a full synthesis of all thirty-five features is beyond the scope of the present work, a few features were explicitly synthesized to demonstrate the strength and merit of the approach. In addition, a number of other mappings were attempted to explore the range of possibilities for the system.
This chapter describes the final system architecture that was developed and details the real-time digital signal processing techniques that were implemented. It also presents the C++ algorithms that mapped the resulting signals to sound. Finally, several etudes ("studies") and compositions will be described in detail, along with descriptions from their public performances. I would also like to acknowledge here that the assistance of MIT undergraduate Noshirwan Petigara through the Undergraduate Research Opportunities Program was particularly appreciated during the development of this phase of the project. While the vast majority of the code that is described in this chapter was written by me, his contributions of code and support were helpful and reliable.
The final Gesture Construction hardware system includes an updated Conductors Jacket, two networked computers, and MIDI-controllable sound production equipment.
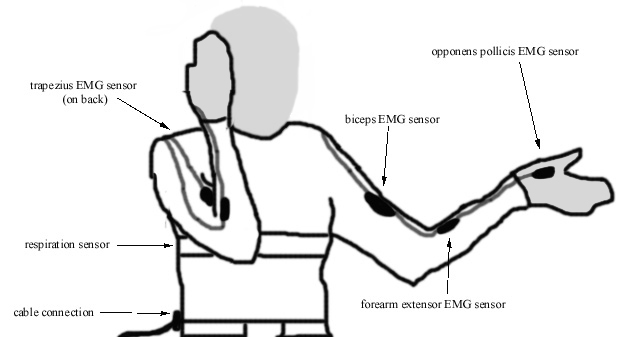
The jacket, worn by myself, uses only the most volitional of the physiological sensors: muscle tension and respiration. I explored various configurations of muscle groups on both arms, and finally decided to use the following seven EMG measurements: right biceps, right forearm extensor, right hand (the opponens pollicis muscle), right shoulder (trapezius), left biceps, left forearm extensor, and left hand (opponens pollicis). All sensors were held in place on the surface of the skin by means of elastic bands, and the leads were sewn onto the outside of the jacket with loops of thread. Additional loops of thread were used to strain-relieve the cables.
The jacket was attached to the computer by means of a cable that was plugged into sensor connections at the wearers belt. Extensive effort went into building a wireless radio transmitter for the data during the Fall 1998 semester, but ultimately the wire proved more reliable and higher-bandwidth. The final Conductors Jacket controller looked like this:
Besides integrating power, ground, and numerous signals, the jacket needed to be practical to use. Therefore, everything was designed such that it could be worn easily; it took no longer to put it on than it would take to wear a turtleneck sweater. After it was on, the sensors had to be adjusted under the elastics so that they reliably contacted the skin. Elastics on the wrists ensured that the EMG sensors would sit in place on the hand. Finally, the belt would be worn, which was attached to the connecting cable. After it was on, the eight sensor connections needed to made and the grounding strap was put in place next to the skin on the inside of the belt.
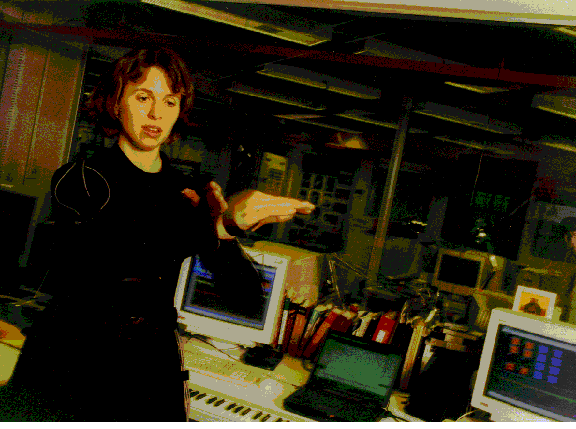
While not perhaps as simple as picking up a violin, the jackets design made it reasonably convenient to wear. The only awkwardness I encountered was when I would be surprised by a request to show my work and would have to leave the room to put on my instrument. This was not optimal for instantaneous demo requests, but otherwise didnt present any serious problem.
To handle the fast data acquisition, filtering and mapping tasks of the system, I decided to use two separate computers. This was done to keep the different tasks modular, to avoid overtaxing a single processor, optimize data rates, and to be able to debug and find timing abnormalities more quickly. Also, it provided for a more flexible development environment, whereby software mappings could switch between many data lines continually. Both machines used the Windows 95 operating system and were connected by a TCP/IP socket over ethernet. They could run either on a large network or on a tiny local network, using a single ethernet hub to link them. I chose to use TCP/IP over a 10 base T ethernet connection since it looked as if it would run faster than RS232 serial, although I did not do a full test on this.
The data flow is achieved by running two separate development applications, one on each computer. The first machine runs National Instruments Labview, which filters, processes and passes the data. The second machine runs Microsofts Visual Developer Studio C++, which accepts the filtered data and maps it to algorithms that generate MIDI output. The computational architecture for the Gesture Construction follows the basic model of a typical computer vision or gesture recognition system, while working within the real-time constraints of interactive music. That is, the data goes through several stages of processing, but its lag times are constant and under five milliseconds. A typical computer vision systems data path generally follows this trajectory:
sensor input -> preprocessing -> feature extraction -> classification -> symbolic output
In the Gesture Construction architecture, the data path differs slightly:
sensor input (x8) -> preprocessing -> filtering -> mapping -> musical output
The implementation details follow: eight lines of sensor data are sent as raw voltages (+/- 10 volts) from the Conductors Jacket. These signals are acquired by a ComputerBoards data acquisition card (CIO-DAS 1602/16), which converts them to 16-bit digital signals at a variable sampling rate. The card sits in an ISA bus on the first Windows 95 machine, and the acquisition rate and voltage range are controlled by a customized Labview application using specific ComputerBoards drivers. The sampling rate for the most time-critical signals is 3kHz; the less important signals are acquired at the board default of 330Hz.
After acquiring the eight channels of data, the customized Labview application processes and filters them, converts all the values to a concatenated string of bytes, opens an ethernet socket connection to the second computer, and sends out a long byte string every 50 milliseconds. All outgoing values are converted from 16-bit fixed-point values to byte integers by first splitting each value into an 8-bit exponent and an 8-bit mantissa. Each individual mantissa and exponent are converted into byte strings, then concatenated as a group into a long string of 751 bytes, and sent out a Windows socket to a specific local TCP/IP address. The socket can be created either over a local-area network or via a two-port hub directly to a neighboring computer; the data rates appeared equivalent whether the data was sent over the Media Lab network or an independent hub.
A second PC running C++ on Windows 95 reads the data from the socket connection, splits off the sensor value components in the right order, scales each mantissa by its exponent, and then assigns each final value to a local variable, defined in an associated header file ("sensor.h"). Each pointer is overwritten by its updated value at every execution of the program. The remainder of the code took those variables and applied them to musical functions that were written in C++ and used the Rogus MIDI library.157 A menu-driven graphical user interface allows the performer to dynamically choose which piece to perform and can select one of several graphing modes so as to get feedback on the data.
A number of unusual tricks were required to get this system to work in real-time. For example, sensor data is acquired at variable rates, depending upon their relative importance, so that the lag times are minimized. Also, the samples are acquired with small buffer sizes (they are collected and processed in windows of 30 samples each, 100 times a second) in order to ensure that real-time responsiveness is achieved. Finally, the two applications have to be launched and executed in a particular order, so that the socket connection is correctly established. Despite the tricks that were required to get it working, this architecture has many advantages. Most importantly, it allows for the latest possible value to be available at each execution of the C++ code, even if the timing of each execution is not reliable or controllable (due to Windows system-level interrupts and inconsistencies with its internal timer mechanisms). This ensures a smoother transition between successive sensor values and fewer glitches in the musical result.