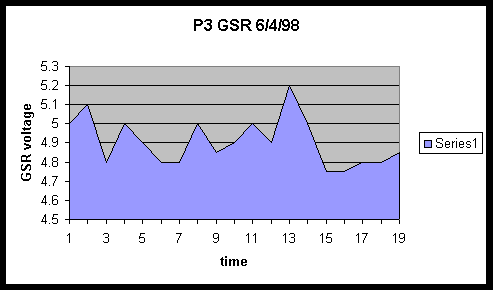
There is a large difference between students and professionals in terms of their GSR variability during the course of a session; the studentsí baselines did not vary noticeably, whereas P1ís GSR had a 1.15 voltage swing and P3ís GSR had a 4.05 voltage swing. During the duration of their individual sessions, S1ís baseline remained at 4.78 volts, S2ís baseline varied from 4.76 to 4.765 volts, and S3ís baseline remained at 4.75 volts. By comparison, P3ís GSR baseline was much more active: it started at around 5 volts (possibly high due to the fact that this was the beginning of a concert), quickly increased when he spoke to the audience, slowly decreased to 4.8 volts by the end of the speech, then increased back up to 5 for the beginning of the first piece. During the course of the first piece it again slowly decreased. The second piece started at 4.9, the third at 4.8. The fourth started at 4.8, crept up to 5.0, and ended at 4.85. The fifth started at 4.9 and ended at 5.0. The sixth, the longest on the entire program, began at 4.9, increased to 5.2, decreased to 5.0, and then steadily diminished to end at 4.75. The seventh piece, the first encore, started at 4.75 and increased gradually to 4.8. The final piece started at 4.8 and ended at 4.85. Figure 40, below, illustrates the activity of P3ís signal during the course of the segment:
