After building the system and collecting the data from the conductors, the next stage was to inspect and analyze the data. Over ten hours worth of conducting data had been gathered, which took up nearly 2 Gigabytes of space. Nearly all of the data was accompanied by timed digital videotapes. The first step I took was to format and print nearly all of the data onto long, scroll-like sheets. One of the longer data files required further filtering and reprinting due to burst-like, noisy interference between adjacent lines.
Next, I sat and compared the files against the many hours of corresponding videotape. After performing preliminary visualization analyses on the data files and noting successive, repeated features, I began thorough cross-comparisons between segments and chose certain portions to focus on. After careful consideration of the complexity in the data and numerous discussions, I decided to use the hand/eye method. This has been used extensively in neuroscience and gestalt psychology. It is commonly used to interpret EEG signals, and neurologists sometimes call it "visual analog pattern recognition." It would have been possible to use numerous automatic recognition systems or other statistical methods, but they would not have yielded interesting musical results.
It also seemed appropriate that I do a visual inspection analysis since my method of collecting conductor data is completely unprecedented. Without first attempting to make sense of the features by eye, any attempt to extract meaning out of the data would have been pointless. In evaluating the data I made use of both a top-down and a bottom-up approach; I began with both the score and video as references, and after choosing to focus on a segment would also use powerful, signal-processing tools. To this end, both my ten years of experience as a conductor and my five years of technical experience were put to good use. My thorough visual analysis produced fourteen significant findings from the visualization of the conductor data. In addition, I identified twenty-one other features that deserve more thorough treatment; these are listed at the end of the chapter. Most of the thirty-five total features reflect higher-level, expressive performance gestures that I hope will be of interest to musicians as well as scientists.
4.1 Interpretive Feature Identification
The Conductors Jacket system was used intensively over five month period during 1998 to gather data from six conductors. After the sessions were recorded, the first task was to sit with the many hours of data files and video footage and see if any visible features emerged. Long, scroll-like printouts were made of the data and lined up with the relevant video segments. Hours were spent sitting and notating interesting features for each segment. Those features that seemed the most consistent and prevalent have been documented and detailed below. While this method has not been refined, it was a first-pass attempt to identify and describe in a limited way the important and useful parts of the data. It is hoped that further studies will be done to collect more data from a wider range of subjects and apply statistics to the findings so as to further quantify and support these results.
For the sake of this paper and other writings on this study, the subjects will be referred to simply by student/professional status and number (in order of when their data was collected). This is to minimize the effect of external associations that the reader might have and to avoid any unintended or unfortunate judgements or comparisons between subjects. Therefore, the six subjects will be mentioned simply as P1, P2, P3, and S1, S2, S3. Of the three professional subjects in this study, all three make a living from their musical performing and teaching in the Boston area. Two conduct mostly professional ensembles, while one conducts mostly amateur and student ensembles. All three permitted data recording during full rehearsals of their respective ensembles; one invited us to record data during a live performance. In all, 6 hours of data were collected from subject P1, 2 hours from subject P2, and 4 hours from subject P3. The student subjects were all taking the Advanced Conducting course at Boston Conservatory; they had all had at least three years of conducting study. Their data was collected while they conducted a pianist and were simultaneously being evaluated by their instructor. All three conducted the same piece: Beethovens Symphony no. 9, last movement. In all, S1 contributed 6 minutes worth of data, S2 5 minutes, and S3 30 minutes. Most of the sensors provided reliable data throughout the experiments, although the heart-rate sensor failed to behave reliably and therefore its data has been discarded. Also, a full analysis of the positional data from subject P3 has not yet been completed, and therefore has not been included here.
The data analysis was accomplished visually, by watching the video and the data simultaneously and picking out the significant features by eye. From the many hours worth of data, fourteen features have emerged that are relatively consistent across individuals and contexts:
As a further note, it should be explained that the Y-axes for all the graphs in this chapter are in the same units and indicate the sampled value of the voltage output of the relevant sensor. That is, the sensor signals were sampled using a 16-bit analog-to-digital converter, which were calibrated such that 5 volts was assigned a value of 0 and +5 volts was assigned a value of 65536. Therefore, a voltage of 0 has a value of 32768 (this is the baseline level of the EMG sensors), and each volt will be represented by an increment of 6554.
4.1.1 Use of the left hand for expressive variation
One of the first features that leapt out of the data was the very clear separation between conductors use of their right and left arms. Since EMG is a measure of muscle tension, not necessarily movement, the EMG signal elucidates when the arm becomes engaged and actively generating signals. Therefore, it sometimes yields surprising results. Traditional conducting pedagogy teaches that the left hand should be used to provide supplementary information and expression; the EMG signals often supported this. The neuroscience literature also has traditionally explained that the right side of the body is used for conscious, controlled actions, and the left side of the body reflects emotion and expression.
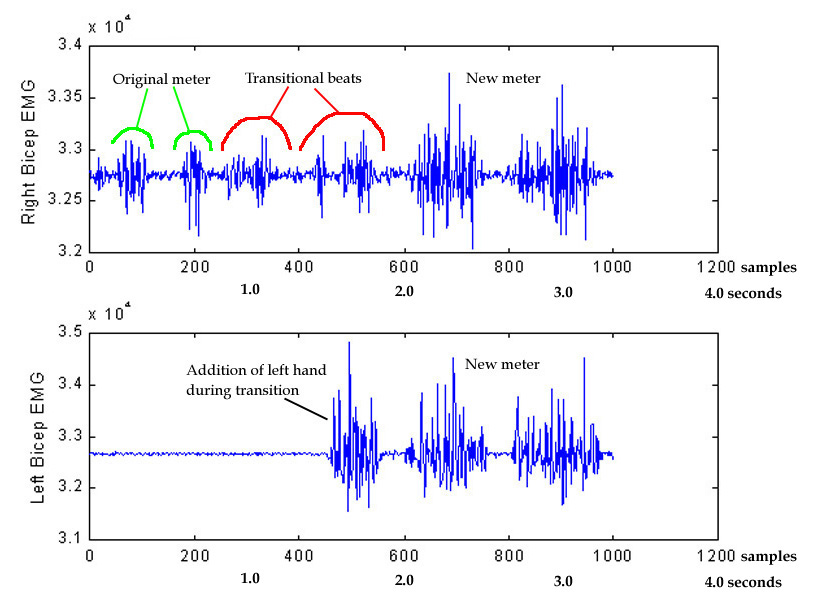
P1s EMG signals demonstrate very clearly how he uses his left hand for extra emphasis; in the first two examples, below, EMG signals from P1s right and left biceps demonstrate how the left hand was used to supplement the information given by the right hand. In the first example, P1 modulated the meter from 2 beats per measure to 1 beat per measure. At the moment just before he intended to change the meter, he reached out his left hand (which was until that moment at his side) and reinforced the new meter with both hands. In the figure shown below I demonstrate how the previous faster meter (where only the right hand was used) transitioned to a slower meter as the left hand entered:
The top graph shows the use of the right arm; in the first 200 samples of this segment, beats occur approximately every 100 samples. Then, during samples 220-600, the beats begin to transition to a new meter that is one-half as fast. These two beats are subdivided, as if to show both meters simultaneously. During the second of these beats, the left hand enters as if to emphasize the new tempo; this is shown in the bottom graph. Following this transition, the slower meter comes into relief (beginning at sample 600), with the new beat pattern showing a clearly defined envelope again.
In another segment of the same session, subject P1 used his left hand to indicate a drastic reduction in loudness at the very end of a movement. As shown in Figure 16, below, the right hand gave all the beats leading up to the ending, but at the last moment the left hand was raised (as the right hand was withdrawn) to indicate a quick volume change and a quiet ending:
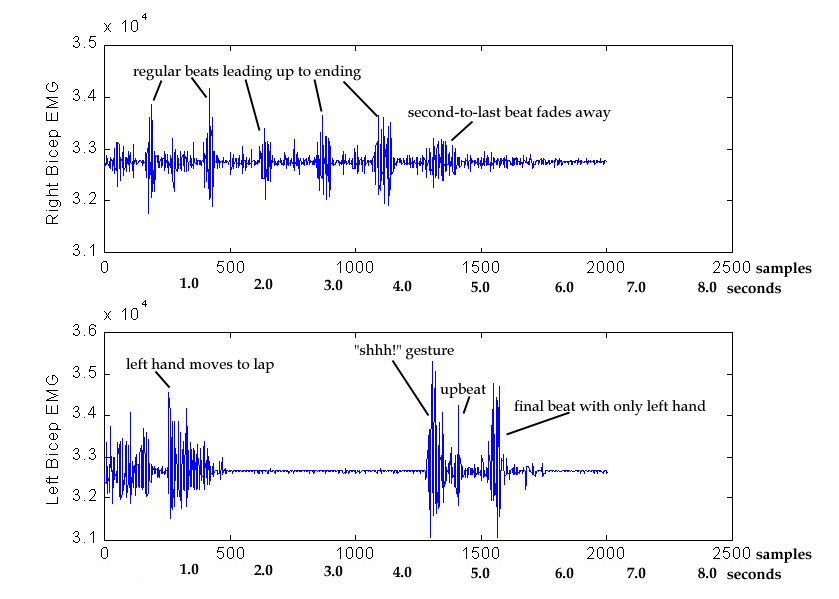
In this example, the right hand drops away at the very end and doesnt indicate the final beat. This drastic change in the use of the hands seems purposeful; the video shows that our subject looked directly at the wind section during this moment, as if he wanted to indicate a very different character for the final woodwind chords. As these first two examples have shown, the subject modified the handedness of his gestures in order to indicate something unusual.
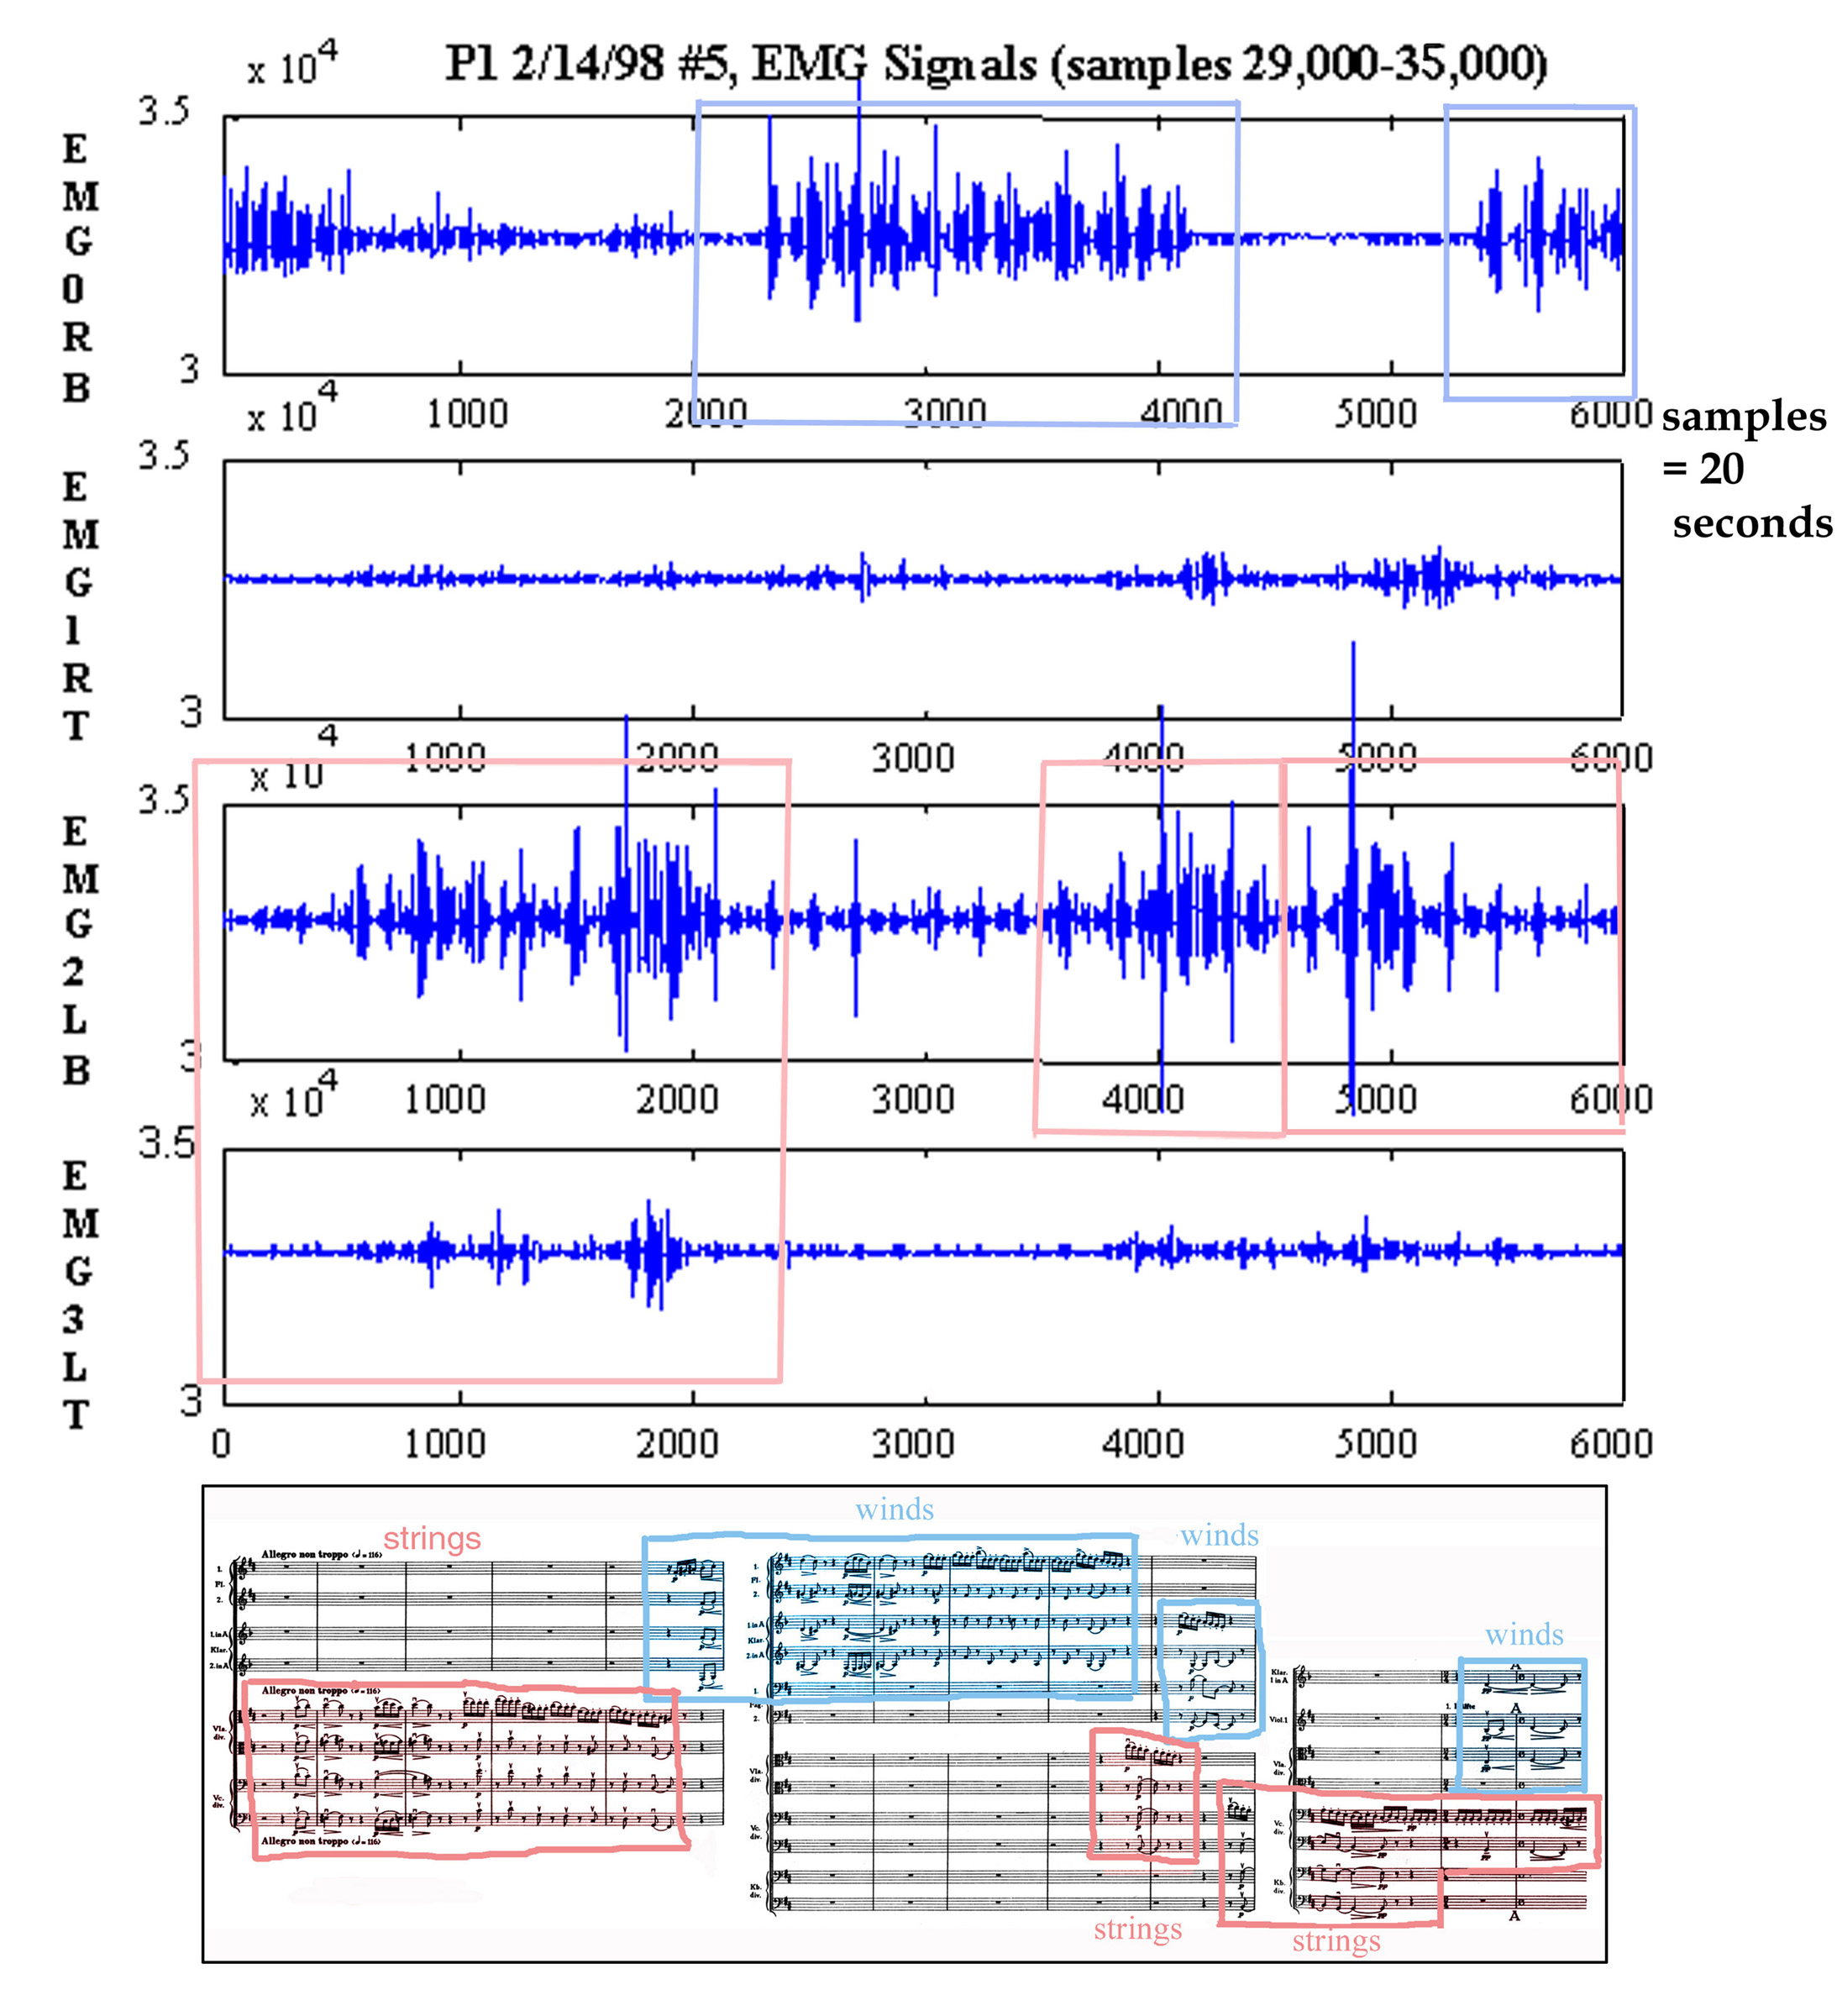
In another example, P1 used his left arm to indicate alternations in groupings within the orchestra; these alternations were written in the score by the composer, and one of the functions of conducting is to exaggerate the structural elements in the score so as to create interesting contrast and character. In the opening theme of the Allegro movement of Tchaikovskys Symphony No. 6, the strings introduce the main theme. In the second statement, the winds take over and repeat with slight variation what the lower strings just did. In order to show this, P1 suddenly minimizes the beats in his right hand and gives most of the gestures with the left hand. Figure 17, below, shows how P1 indicates the different orchestration groupings by switching arms. Note that the second time the winds come in, he does not give a separate indication perhaps this can be explained by the quickness of the entrance or the dynamic marking of piano:
The other subjects demonstrated similar patterns in their division of labor between their arms that is, the right arm tended to keep things together, while the left arm was used for expression. The right-hand beat pattern is optimized for giving tempo and dynamics indications, in functions somewhat like traffic direction. The one-to-one, symbolic things are given with the right hand, while the continuous, fuzzy, qualitative measures are given with the left.